Moving Company Website Design
With the moving industry being such a widespread and profitable industry, there are many moving trends that one can analyze. In this report, we will include as much information as possible that we consider practical and potentially profitable for your moving business.
Benefits of having an ADA Compliant Moving Website
Studying Americans’ moving habits is a fascinating way to learn more about our culture’s love for new horizons. No strangers to change, the average American moves approximately 11.7 times throughout their lifetime.
Consider this in the context of the average American household’s 2.3 people, and you get 15.3 million American households uprooting annually. Of this number, about three million Americans end up making an interstate more.
Who does most of the moving? When broken down by demographic, moves fall into the following categories:
- Individual or family: 44 percent
- Corporate: 38 percent
- Government: two percent
- Military: 16 percent
We can distill these stats down further, arriving at a portrait of the “average movers.” They’re a couple between 18 and 34 years old with one or two children.
How many are renters versus homeowners? Renters take part in most moves, even though they now move less than a generation ago.
To give you an idea, 21.7 percent of renters moved in 2017 as opposed to 35.2 in the late 80s. As for homeowners, 5.5 percent moved in 2017 as compared to 9.5 percent in the late 80s.
As you can see, the younger the individual (or couple), the more likely they are to entertain a move. As we age and feel more settled, the tendency to move drops off substantially.
Did you know that every year, 31 million Americans pull up their roots and relocate? That’s 9.8 percent of Americans on the move each year.
according to the American Moving & Storage Association – there are around 7000 moving companies in the US! That’s definitely an impressive number! And it shows that moving in the US is definitely something that happens all the time; with the help of an extremely developed service industry.
47.8% of these companies don’t employ more than 5 people; which is definitely one of the most interesting moving industry statistics. Indeed, large corporate entities make up less than 10% of the moving industry.
Given the COVID-19 crisis and the issues that 2020 has brought forth so far, we will probably see the rapid growth of local moving projects, with people not willing to risk crossing state lines without guarantees.
Web Accessibility for your Moving Website
The fact is that millions of internet users have special needs, disabilities, and impairments that can make it difficult or even impossible for them to use certain types of websites. By designing your site with these challenges in mind, you can ensure that it’s welcoming to as many users as possible.
The strength of the moving industry tends to reflect that of the nation’s economy. Since the end of the Great Recession, the industry has grown by approximately three percent annually. That makes for plenty of moving companies!
To be exact, there are 7,000 moving companies in operation, servicing 13,900 locations nationwide. They’re directly responsible for the creation of 186,722 jobs and indirectly for 482,081 on top of that.
All told, the industry directly employs 122,600 individuals, and they pay approximately $3.6 billion in combined annual payroll. These employees generate about $9.42 billion in tax revenues per year. What’s more, the moving industry remains in lock-step with the self-storage sector, resulting in $36 billion in profits yearly.
To give you an idea of just how big the self-storage unit piece of the market is, think about this. More self-storage units exist in the United States than McDonald’s and Starbucks franchise locations put together. Considering how much Americans love their Big Macs and Frappucinos, that’s an impressive figure!
How do the costs associated with a move get divided? Expenses can be categorized as follows:
- Miscellaneous costs: 2.7 percent
- Packing and packaging: 7.5 percent
- Storage: 20.2 percent
- Expenses related directly to the move: 69.6 percent
Now that you have a better idea of just big the moving industry pie is, let’s examine the behavioral aspects of moving industry trends.
Moving Website Trends
When it comes to the size of residential moves, the data is slightly different in comparison to 2018. With an increase in the percentage of 1-bedroom (28.81%) and 2-bedroom homes (21.16%), the relocation of 3-bedroom (20.27%) and 4-bedroom homes (12.69%) has dropped in numbers in 2019.
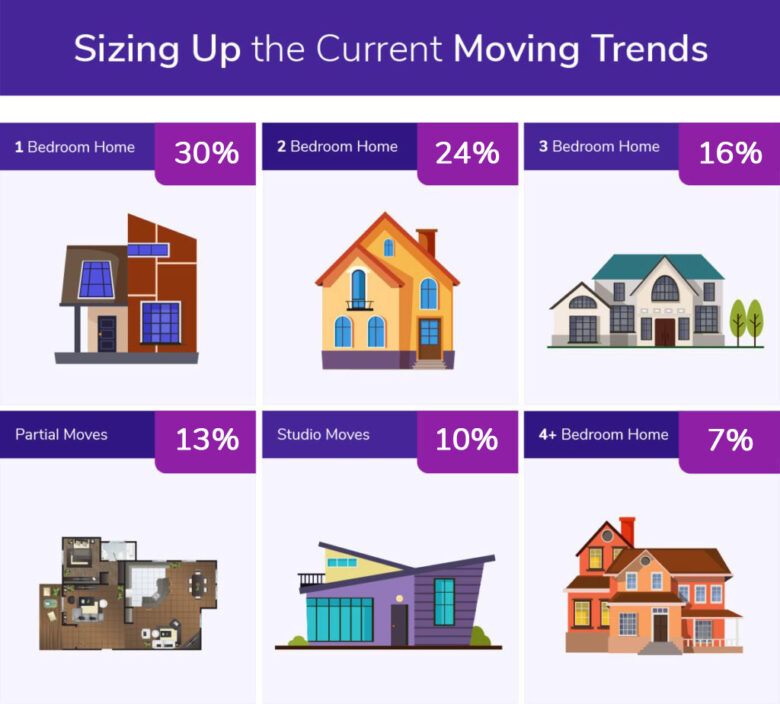
- 1 Bedroom – 30%
- 2 Bedroom – 24%
- 3 Bedroom – 16%
- 4+ Bedroom – 7%
- Studio – 10%
- Partial move – 13%
Studio moves and partial move have remained similar in volume, which only goes to show how gradual changes are when it comes to the US moving industry statistics, with no spiking in number. Although people continue to relocate, it takes years for specific moving trends to define themselves and become obvious.

Mobile Ready Web Design

Blog Options

Search Engine Friendly

What About the Busiest Date for the Moving Industry in 2019?
As we mentioned earlier, relocation industry statistics are shifting toward the spring months, and the dates are here to confirm that. Even back in 2018, June 1st marked dominance in comparison to other dates during the year. However, unlike the runner-up position that August 1st had last year, in 2019 that status was claimed by May 31st. It remains to be seen how the COVID-19 crisis and riots have influenced the summer of 2020.
While we’re on the subject of the places with the most local moves, it’s worth bearing something in mind; the term ‘local moving’ is wider than you might think. When we say someone is relocating locally, we don’t just mean they’re moving to a new apartment a few blocks down. This actually means someone is moving within the same state. So, with that in mind – which states have the most internal relocation? In the US, Florida, Texas, and California are places people move around locally the most.
Moving Websites gives responsive and innovative website design! Browse our Sample Works and Contact Us today to discover exactly how you will certainly gain from a website!